team8s
brandon, eric, henri, sophie
Lab 2: Analog Circuitry and FFTs
Subteams: Eric and Henri, Brandon and Sophie
Objective
In this lab, our goal was to add sensors to our robot and make analog circuits and a digital filter to interface with the Arduino. We split into two teams: the acoustic team (Eric and Henri) and the optical team (Brandon and Sophie). The acoustic team aimed to build a microphone circuit detecting a 660 MHz whistle signifying the beginning of the maze mapping, and the optical team interfaced with an IR sensor to detect nearby robots emitting IR at 6.08kHz, and to distinguish them from decoys emitting IR at 18kHz.
FFT Library
For both parts of this lab, we had to use the FFT library from Music Lab’s FFT page. This library provides functions for doing FFT in Arduino. This was important for both groups because it allowed us to identify specific frequencies that we were looking for in the signals that we were reading.
Both subgroups used the example sketch fft_adc_serial, as the basis for our code. This sketch manually reads data (as opposed to using analogRead()) from pin A0, and records it in alternating entries of the array fft_input. The remaining entries are filled with 0’s, as these correspond to the imaginary parts of the signal. After the array is filled, the sketch calls the necessary library functions to process the input and places magnitudes for different frequencies into bins, in the array fft_log_out. The sketch then prints the magnitude of each bin on a separate line to the serial monitor.
Acoustic
After assembling and testing the basic microphone circuit, we were able to measure a 660 Hz tone. However, this tone had a DC offset of 250 mV and an amplitude of 40 mV. Due to this, we needed to build an amplifier and a filter in order to create a signal large enough to be easily read by the ADC converter. This way, we are able to run the signal through an FFT and clearly view the frequency of the signal.
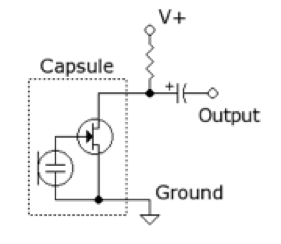
Once we confirmed that our microphone was working, we connected it with both an amplifier and an analog filter. We used Team Alpha’s design, as our attempts with other designs failed and we were constrained by time -- while we were able to make a microphone and amplifier/filter work separately, when put together they would not work reliably due to biasing issues. In Team Alpha’s design, the output of the mic is passed through a capacitor to remove the DC bias and then through an inverting amplifier with 10x gain with the other terminal biased at 2.5V.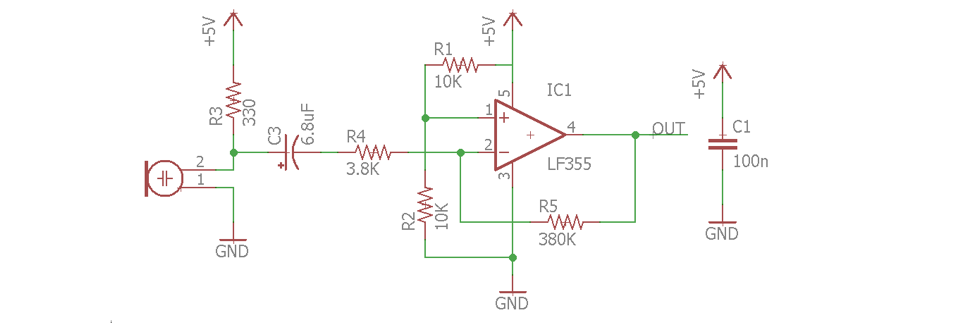
(From Team Alpha’s website.)
Upon testing the circuit with the function generator and the oscilloscope, we could see that it clearly amplified the inputted function. When attached to a microphone and playing sounds of various frequencies (using the Tone Generator app), it clearly took in a signal and then amplified it.
Once we confirmed that our circuit worked, we attached the output pin to A0 on the Arduino. We then ran fft_adc_serial(), played a 660Hz tone, and got a spike in bin 5 -- as expected. Just to check, we tried a few other frequencies and watched the spikes appear in their corresponding bins.
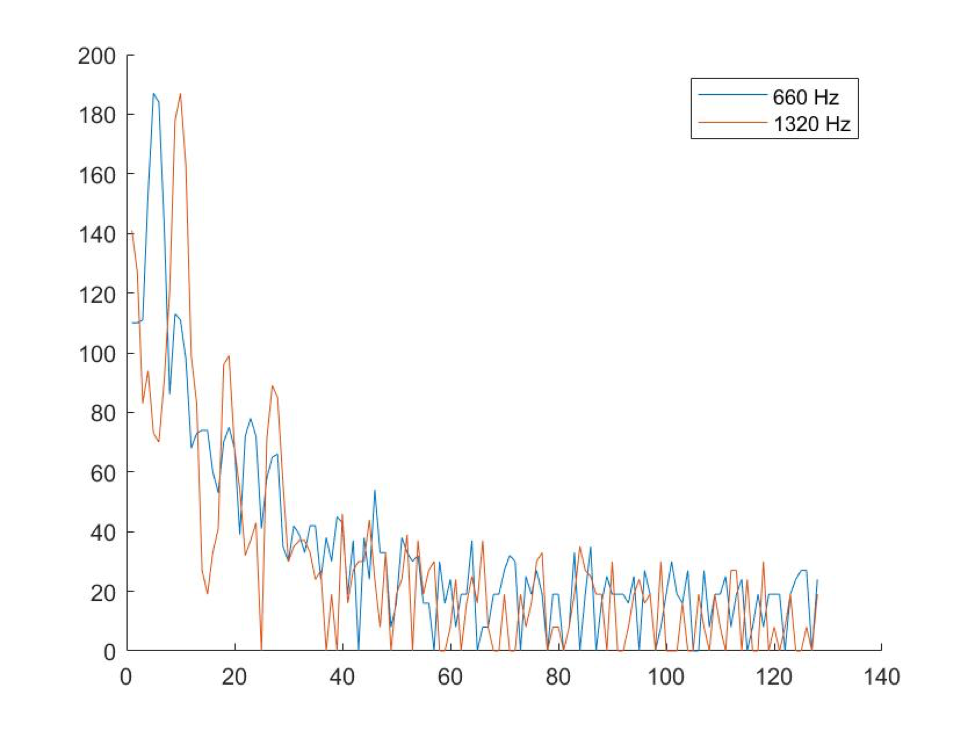
In this example, we ran the FFT with 660Hz and 1320Hz once each; it is clear that for the 660Hz signal, the peak appeared in bin 5, while for 1320Hz the spike appeared in bin 10 -- which is expected, as it is twice the frequency of 660Hz.
IR Detection Circuitry
We built a bandpass filter to be able to detect other robots emitting a frequency of 6.08kHz. The purpose of the filter is to cut out other frequencies, like the IR decoys. To get the resistor and capacitor values for our circuit we used an online calculator.
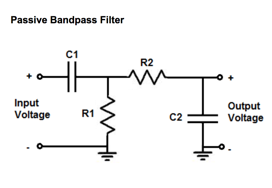
Component values
C1 = 100nF
R1 = 330 Ohms (to ground)
C2 = 1nF
R2 = 24 kOhms (to output)
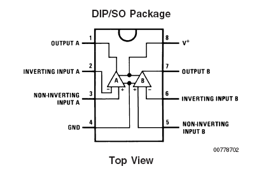
We also built an amplifier because the reading we got from the output of the transistor was very small in magnitude, especially from far away. We chose to use an non-inverting op amp circuit because it is simple and easy to build. We based our design on the image below. The gain of the non-inverting amp is equal to 1 + Rf/R2, so with the resistor values we chose, we have a theoretical gain of about 1000. The pinout for the op amp that we used is also below.
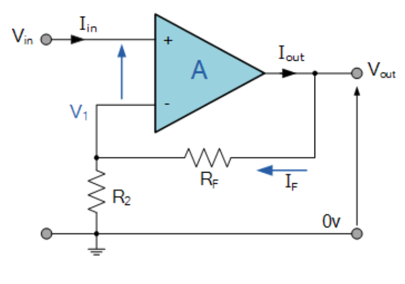
Resistor values
Rf = 100 kOhms
R2 = 100 Ohms
Texas Instruments LM358P
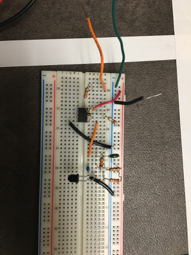
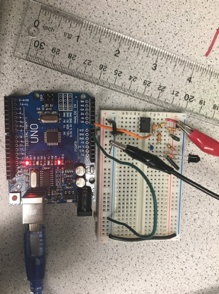
Our initial circuit is on the left, and a mor epolished version is on the right.
Testing the Circuit
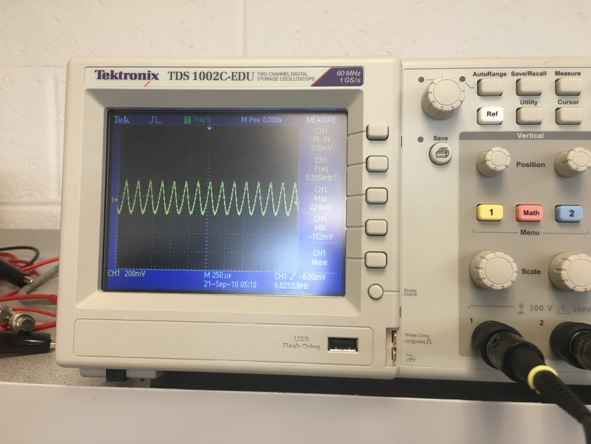
We initially used unit tests to determine if the amplifier was working. We first just put a DC signal, through the amplifier and measured the output using the oscilloscope. We actually measured gain equal to double what we expected, however after talking to other groups we realized that several others were experiencing the same thing. It turned out that the reading at the input was also double the amplitude of what we expected, so the gain was actually correct. We then tested the amplifier with a sinusoidal signal from the signal generator, and again saw correct results.
When we combined the filter with the amplifier, we read very good results on the oscilloscope. We were able to get notable readings of about 400 mV, peak-to-peak, from one foot away (the distance between intersections, and when the IR and transistor get very close, the peaks of the signal end up hitting the rails of the op amp.
IR Detection Code
Once we were confident that the circuitry for the IR transistor was working correctly, the next step was to use the FFT library to try to detect the IR hat using the Arduino. We started off by using the fft_adc_serial example sketch. We added a while(1) at the end of the loop() function to cause the function to stop after collecting and printing one set of data. The data we collected can be seen below.
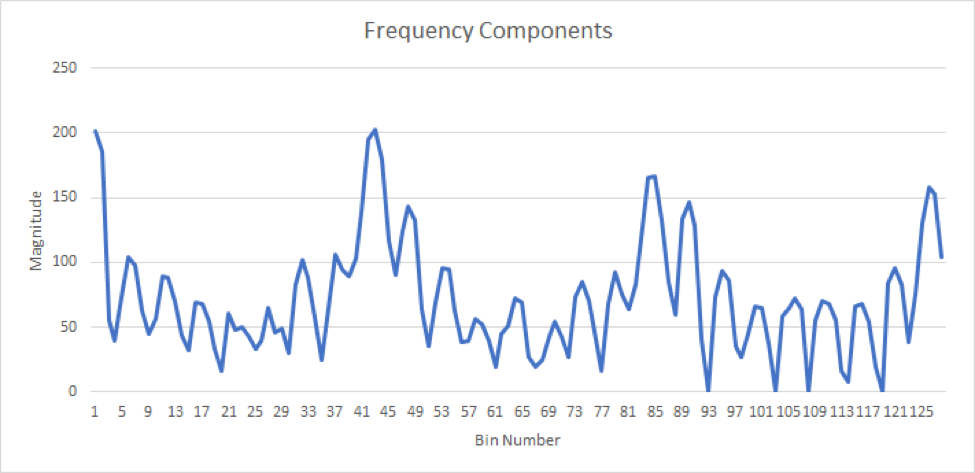
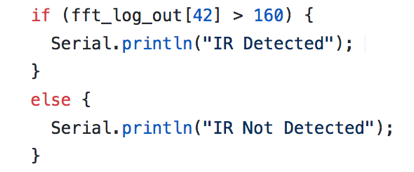
As you can see, there are several peaks, which are harmonics of the actual signal. The highest peak occurs in bin number 43, where the magnitude is about 200 when the transistor and hat are very close to each other. Now to check if we are near an IR hat, we just run the code from the example sketch, and instead of printing all of the values recorded at the end we just check the value in bin 43 (index 42). If the magnitude is above a certain threshold, which we may change the value of later, then for the purposes of this lab, we print “IR Detected” to the serial monitor. If it is below that threshold, we print “IR Not Detected”. When we actually implement the code in our robot, we would change this to be some reaction to encountering another robot, perhaps stopping or turning around.
IR hat detects 4.25 inches away
Video of IR hat testing
We found that our solution is robust enough that it can differentiate between the IR hat and the IR decoys. As you can see in the video below, when we place the IR decoy between our circuit and the IR hat, the serial monitor reads “IR Not Detected”, and when we remove it again, the printed message changes to “IR Detected”.
Video of IR hat and does not detect decoy
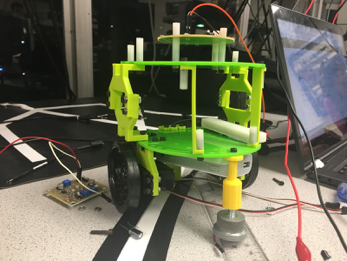
Robot Repositioning
To accommodate placing the IR hat at 5.5 inches above the ground, we had to rethink the layout of our robot. We put the hat where the Arduino used to be, and decided to move the Arduino down to the lower level, where the battery was before. We moved the battery to the bottom of the robot and attached it with velcro.